The price of Stellar (XLM) has seen a significant surge in the last 24 hours, making it the second top gainer of the day after XRP. This rally could be attributed to Ripple Labs’ recent legal victory, which confirmed that XRP is not considered a security in the United States.
Jed McCaleb co-founded Stellar and Ripple, so their prices may sometimes exhibit similar trends. Over the past day, XLM has risen over 46%, with gains of around 50% on the weekly chart.
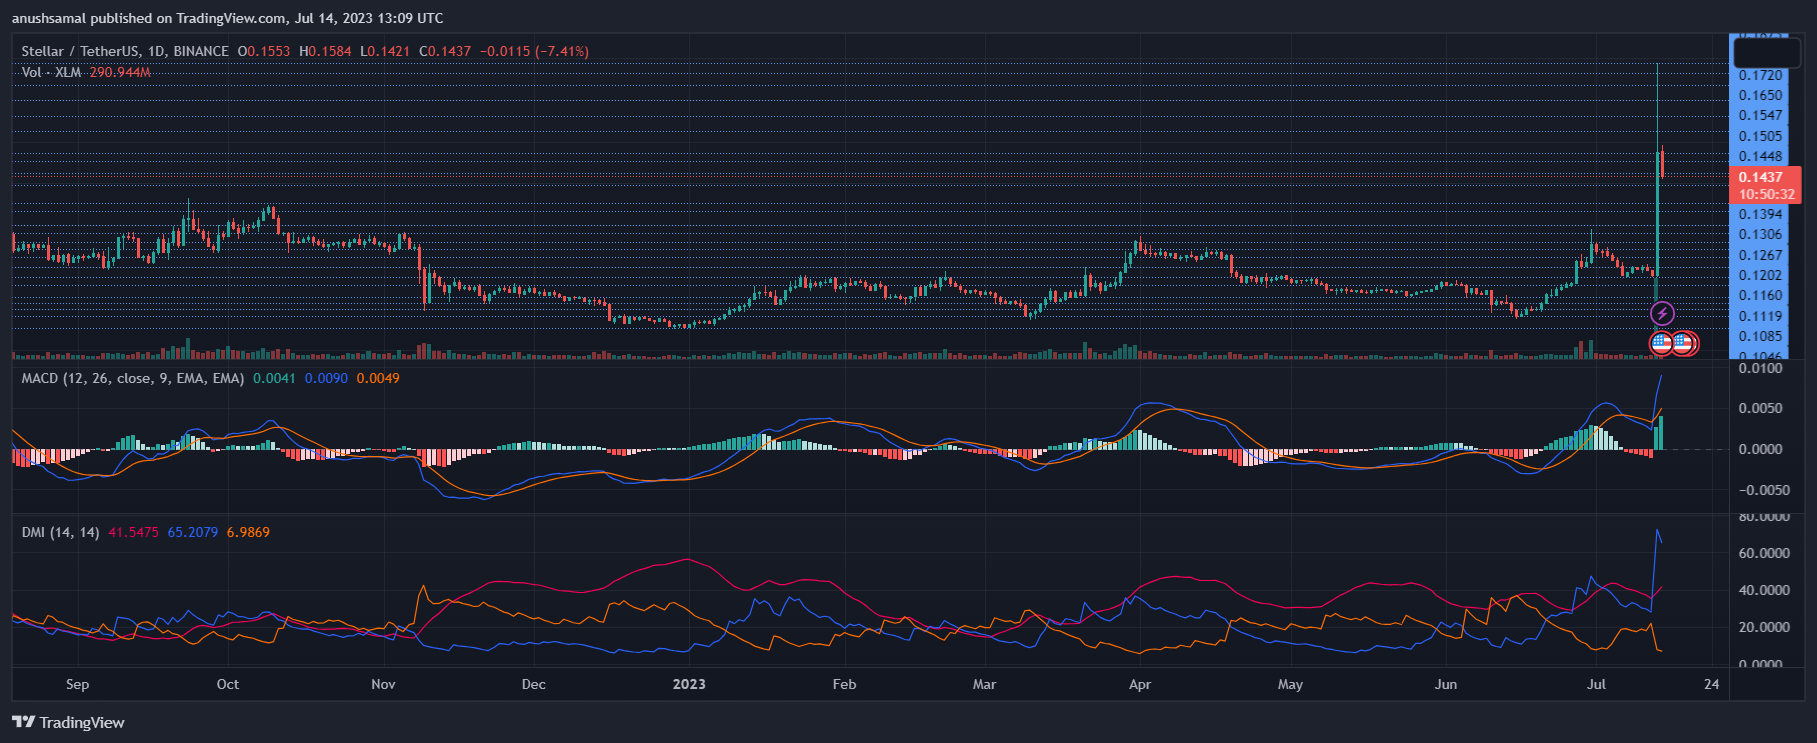
The technical outlook for the coin shows a strong bullish influence, with demand and accumulation seeing a significant increase.
However, it’s important to note that with any rally, there’s always the possibility of a price pullback. XLM must maintain a price above a certain mark to avoid the bears taking over. The increase in market capitalization of XLM is also a bullish sign, as it indicates a rise in buying volume.
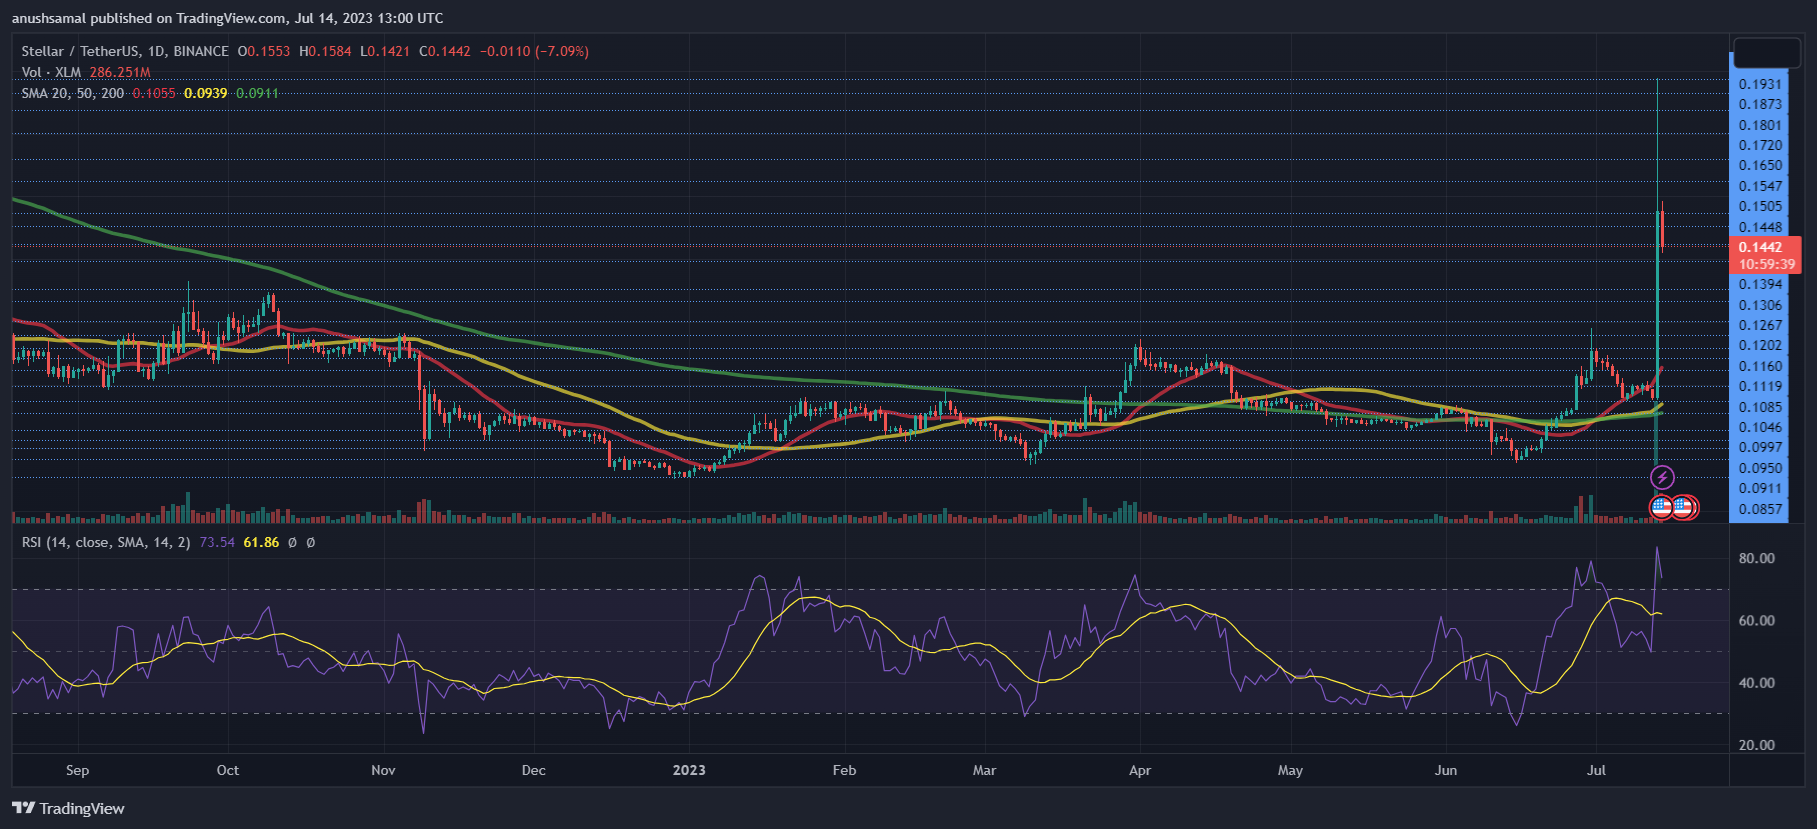
As of writing, XLM was trading at $0.143 and has followed a similar price trajectory as XRP. The last time XLM hit this price level was in May last year; this marked a yearly high for the coin.
Overhead resistance for Stellar (XLM) is currently at $0.160, and breaking through this level would strengthen the bullish trend.
If XLM manages to break through this resistance level, it could reach $0.180, which may prove to be a challenging resistance level for the coin.
Local support for XLM is presently at $0.131, and if the price falls to this level, the bears could take over, potentially causing the price to drop to $0.111. The trading volume of Stellar (XLM) has surged by a massive 3390%, indicating strong bullish sentiment.
On the one-day chart, XLM was considered overvalued and had entered the overbought zone. The Relative Strength Index (RSI) was just below the 80-mark, indicating buying strength in the market.
XLM was also positioned above the 20-Simple Moving Average (SMA) line. This further confirmed that buyers were the driving force behind the price momentum in the market.
XLM formed buy signals in response to demand. The Moving Average Convergence Divergence (MACD) indicator showed price momentum and a potential reversal. The indicator formed two tall green histograms corresponding to buy signals growing in size.
This suggests that the price may continue to increase before retracing, suggesting that the current price level could be an entry point for traders.
The Directional Movement Index (DMI) was also positive, with the +DI line (blue) above the -DI line (orange), indicating positive momentum for the coin. The Average Directional Index (ADX) was above the 40-mark, hinting that price momentum was gaining strength on the one-day chart.
Featured image from Stellar.org, charts from TradingView.com
Breakdowns, equipment failure, outages and other shop floor disruptions can result in big losses for an organization. Production managers are tasked with ensuring that factories and other production lines are getting the most value out of their equipment and systems.
Overall equipment effectiveness (OEE) and total effective equipment performance (TEEP) are two related KPIs that are used in manufacturing and production environments to help prevent losses by measuring and improving the performance of equipment and production lines.
What is overall equipment effectiveness (OEE)?
OEE is a metric used to measure the effectiveness and performance of manufacturing processes or any individual piece of equipment. It provides insights into how well equipment is utilized and how efficiently it operates in producing goods or delivering services.
OEE measures the equipment efficiency and effectiveness based on three factors. The OEE calculation is simple: availability x performance x quality.
What is total effective equipment performance (TEEP)?
TEEP is also a metric used in manufacturing and production environments to measure the overall efficiency and effectiveness of equipment or a production line. It includes all the potential production time, including planned and unplanned downtime.
The main difference between these two metrics is that while OEE measures the percentage of planned production time that is productive, TEEP measures the percentage of all time that is productive.
It’s important when making these calculations of time to use the right terminology. Here are a few common ways to measure time within a production context:
Unscheduled time: Time when production is not scheduled to produce anything (as opposed to “scheduled time”).
Calendar time: The amount of time spent on a job order up to its completion.
Total operations time: The total amount of time that a machine is available to manufacture products.
Ideal cycle time: The theoretical fastest possible time to manufacture one unit.
Run time: The time when the manufacturing process is scheduled for production and running.
OEE primarily focuses on the utilization of available time and identifies losses due to availability, performance and quality issues. It helps identify areas for improvement and efficiency optimization.
TEEP, on the other hand, provides a broader perspective by considering all potential production time, including planned downtime for preventive maintenance or changeovers. It aims to measure the maximum potential of the equipment or production line.
OEE is typically used to measure the performance of a specific piece of equipment or a machine. It helps you understand how effectively equipment is being utilized during actual production time. OEE is commonly used as a benchmarking tool to track and improve equipment performance over time. It helps identify bottlenecks, areas for optimization and improvement initiatives.
TEEP is used to measure the overall performance of an entire production line or multiple pieces of equipment working together. It provides a holistic view of the effectiveness of the entire system. If you are interested in understanding the maximum potential performance of your production line, including planned downtime for maintenance, changeovers or other scheduled events, TEEP is the performance metric to use. TEEP can be helpful in production capacity planning and determining the capabilities of your equipment or production line.
How can OEE and TEEP be used together?
Start with OEE analysis: Begin by calculating the OEE for individual machines or equipment within your production line. OEE analysis helps pinpoint the causes of losses and inefficiencies at the equipment level. A digital asset management platform can provide real-time data to help with this calculation.
Identify bottlenecks: Use OEE data to identify bottlenecks or areas where equipment performance is suboptimal. Look for machines with lower OEE scores and investigate the underlying issues. This can help you prioritize improvement efforts and target specific machines or processes that have the most significant impact on overall performance.
Evaluate TEEP for the entire line: Once you have assessed the OEE for individual machines, calculate the TEEP for your entire production line. TEEP takes into account all potential operating time—including planned and unplanned downtime—providing a broader perspective on the overall performance of the line.
Compare OEE and TEEP: Compare the OEE and TEEP data to gain insights into the gap between actual performance and the maximum potential performance of the production line. Identify the factors contributing to the difference between the two metrics, such as scheduled maintenance, changeovers or other planned downtime. This comparison can help you understand the overall efficiency and effectiveness of the production line.
Address common issues: Analyze common issues identified through OEE and TEEP analysis and devise strategies to address them. This may involve improving machine reliability, procuring new equipment, integrating continuous improvement methodologies, reducing setup or changeover times, enhancing product quality or optimizing maintenance management. Implementing targeted improvement initiatives can help bridge the performance gap and maximize the overall equipment performance.
Track progress over time: Continuously monitor and track both OEE and TEEP metrics over time to assess the effectiveness of your improvement efforts. Regularly evaluating these metrics allows you to measure the impact of implemented changes and identify new areas for optimization.
By combining OEE and TEEP, you can conduct a comprehensive analysis of current equipment performance at both the individual-machine and production-line levels. This integrated approach provides a deeper understanding of performance factors, helps prioritize improvement efforts, and maximizes the overall effectiveness and efficiency of your manufacturing operations, allowing production managers to achieve higher throughput and maximum uptime.
World-class observability with IBM Maximo
IBM Maximo is enterprise asset management software that delivers a predictive solution for the maximization of equipment effectiveness. Maximo is a single, integrated cloud-based platform that uses AI, IoT and analytics to optimize performance, extend the lifecycle of assets and reduce the costs of outages.
Take a tour to see how Maximo can achieve OEE improvement while reducing the operations costs of overtime, material waste, spare parts and emergency maintenance.
Sign up for the tour
The post OEE vs. TEEP: What’s the difference? appeared first on IBM Blog.
Binance is reported to have dismissed about 1,000 of its employees recently.
The report cites sources close to the exchange and comes at a time Binance is battling regulatory pressure.
The leading crypto exchange celebrated its 6th birthday on July 14.
Binance, the world’s largest cryptocurrency exchange by trading volume, has reportedly cut its employee number by 1,000 in recent weeks.
The Wall Street Journal reported on Binance’s layoffs on Friday, citing a source as saying the crypto exchange could still dismiss more of its workforce in coming months amid staff reorganization. According to the report, the crypto company could lay off up to a third of its workforce.
Binance celebrated its sixth year since it launched today, July 14, 2023.
6 years ago today, a little exchange called @Binance launched. Everyone was telling me there is no chance for another exchange. Here are some reflections over the last few years. Thank you for your unwavering support! ???? https://t.co/9O4UnE3G36
Multiple crypto and mainstream companies have in the past year or so aggressively cut on their headcount, with crypto’s situation exacerbated by the debilitating crypto winter. Binance was among those to eye staff reduction as Wu Blockchain revealed in a May 31tweet.
Prior to the expected employee cut, the Changpeng ‘CZ’ Zhao led company had an estimated 8,000 employees globally. Reports highlighted plans to send 20% of the workforce home.
Binance remains the world’s largest crypto exchange by trading volume. However, the past month has been tough for the company in terms of the myriad of regulatory challenges it has faced.
The early June lawsuit by the US Securities and Exchange Commission (SEC), came as the exchange exited a number of countries due to regulatory reasons. It included Belgium and the Netherlands, and it ended its pursuit of a license in Austria. Menwhile, it also faced scrutiny in France and recently Australia.
There have also been exits by top executives, including exchange’s former Chief Strategy Officer Patrick Hillmann.
Arbitrum is one of the many Layer-2 rollups in the space helping to make transactions faster and cheaper on Ethereum. However, Arbitrum has managed to stand out from the rest, emerging as a leader in this sector.
Arbitrum Controls Majority Of Layer-2 TVL
Arbitrum, despite being younger than some of the Ethereum Layer-2 blockchains in the market, has been able to snag a significant portion of the market share for itself. According to data from DeFiLlama, the Layer-2 blockchain accounts for approximately 70% of in total value locked (TVL) across all Layer-2 blockchains.
Out of the over $4 billion locked across each of these networks, Arbitrum’s TVL is currently sitting at $2.794 billion. This puts it ahead of its predecessor Polygon, and fierce rival Optimism, both of which have TVL of $1.088 billion and $907 million, respectively.
Arbitrum accounts for 70% of Layer-2 TVL | Source: DeFiLlama
However, when it comes to daily active users, the Polygon blockchain is ahead of its peers. DeFiLlama’s data shows that in the last 24 hours, Polygon’s active users have crossed 404,000, while there have been a total of 161,273 active daily users on Arbitrum, with 104,927 daily active users for rival Optimism blockchain.
Nevertheless, Arbitrum leads in terms of volume with $481 million in the last day. To put this in perspective, Polygon’s 24-hour volume is sitting at $240 million and Optimism is recording only $75 million, coming out as the poorest performer of the couple.
Will ARB Be A Great Performer In The Bull Market?
Now, Arbitrum launched its native ARB token in what is arguably a bear market, and given this, the token has not performed too well. However, given the performance of the Layer 2 blockchain coupled with its growing popularity, it could just be the bullish narrative needed to outperform in the bull market.
If Arbitrum continues to grow and Layer-2 blockchains maintain their dominance, then a repeat of the 2021 bull market is not out of the ordinary. To put this in perspective, the price of Polygon’s native token, MATIC, went from $0.017 in January 2021 to almost $3 by January 2022. If ARB follows this same pattern, then it is possible that the digital asset hits $10 in the next bull market.
For now, ARB is still following the general market trend. The price of the digital asset is up 9.34% in the last day to put its price at $1.24 at the time of this writing.
Crypto exchange Coinbase is pausing its retail staking service in California, New Jersey, South Carolina and Wisconsin after those states said they would require changes to those services while its proceedings against such staking services move forward. Crypto staked before the orders were issued will remain unaffected.
Alex Mashinsky, the founder and former CEO of Celsius, pleaded not guilty to charges of misleading customers and artificially inflating the CEL token shortly after being arrested on Thursday. Following this, he was released on bail by a US District Judge on a bond of $40 million.
According to a court document filed on Thursday, the personal recognizance bond for Alex Mashinsky is secured by his Manhattan residence, as well as the signatures of his wife and another individual.
Benjamin Alee and Jonathan Ohring are the attorneys representing Alex Mashinsky, and in a statement, Ohring mentioned that Mashinsky is eager to defend himself in court against what he believes are unfounded charges.
Related Reading: Dapper Labs Lays Off 51 Amid NFT Market Slump In Third Round Of Cuts
Following attorney Benjamin Alee’s statement of Mashinsky’s not-guilty plea, Mashinsky left the court without commenting. When the magistrate judge asked if the plea was indeed not guilty, Mashinsky confirmed that it was.
Restrictions Imposed On Mashinsky
As part of the bail agreement, Mashinsky will face restrictions that include a ban on travel and opening new bank or cryptocurrency accounts. For now, Mashinsky’s travel is restricted to the Eastern and Southern Districts of New York.
Furthermore, according to the agreement, Mashinsky’s wife will be required to sign the bond, while the identity of the second co-signee remains undisclosed. The bond will also be secured by a financial claim on Mashinsky’s bank account and his residence in New York City.
The arrest and bail arrangement of Alex Mashinsky were part of a coordinated effort by several entities, including the Department of Justice, the Federal Trade Commission, and federal securities and commodities regulators.
On the same day of the arrest, the Commodity Futures Trading Commission (CFTC), Federal Trade Commission (FTC), and Securities and Exchange Commission (SEC) filed lawsuits against Celsius and Alex Mashinsky. In addition, Mashinsky was charged by the Department of Justice with seven counts, including securities and wire fraud.
Promotional Strategies Of Celsius Exposed In Indictment
Celsius, founded in 2017, filed for bankruptcy in July 2022. According to prosecutors, from 2018 to 2022, Mashinsky misled investors about fundamental aspects of Celsius’ operations.
The indictment against Mashinsky states that between 2018 and 2022, he presented Celsius to customers as a secure platform for depositing their cryptocurrency assets and earning interest, akin to a modern-day bank.
However, prosecutors allege that Mashinsky actually operated Celsius as a high-risk investment fund, misleading customers and exposing them to a risky business model.
In addition, the indictment claims that Mashinsky utilized his Twitter account, media interviews, and Celsius’s website to promote the platform.
Regulators assert that despite experiencing significant losses and facing pressure from withdrawals, Mashinsky and Celsius made false claims regarding the platform’s financial stability, leading to an exponential increase in its customer base, largely composed of retail investors.
Apart from the recent charges, New York Attorney General Letitia James had previously filed a lawsuit against Alex Mashinsky in state court, alleging that he had deceived thousands of investors, including 26,000 New Yorkers.
The total crypto market cap was at $1.21 trillion on the one-day chart | Source: TradingView
Featured image from The New York Times, chart from TradingView.com
Enterprises are often defined by how they deal with events that are out of their control. For example, how you react to a disruptive technology or cope with a sudden change in the markets can be the difference between success and failure.
Contingency planning is the art of preparing for the unexpected. But where do you start and how do you separate the threats that could do real harm to your business from the ones that aren’t as critical?
Here are some important definitions, best practices and strong examples to help you build contingency plans for whatever your business faces.
What is a contingency plan?
Business contingency plans, also known as “business continuity plans” or “emergency response plans” are action plans to help organizations resume normal business operations after an unintended interruption. Organizations build contingency plans to help them face a variety of threats, including natural disasters, mergers of rival companies, data loss, network breaches and sudden shifts in customer demand.
A good place to start is with a series of “what if” questions that propose various worst-case scenarios you’ll need to have a plan for. For example:
What ifa fire broke out in the warehouse where you keep confidential customer records?
What ifyour top three engineers all quit at the same time?
What ifthe country where your microprocessors are built was suddenly invaded?
Good contingency plans prioritize the risks an organization faces, delegate responsibility to members of the response teams and increase the likelihood that the company will make a full recovery after a negative event.
Five steps to build a strong contingency plan
1. Make a list of risks and prioritize them according to likelihood and severity.
In the first stage of the contingency planning process, stakeholders brainstorm a list of potential risks the company faces and conduct risk analysis on each one. Team members discuss possible risks, analyze the risk impact of each one and propose courses of action to increase their overall preparedness. You don’t need to create a risk management plan for every threat your company faces, just the ones your decision-makers assess as both highly likely and with a potential impact on normal business processes.
2. Create a business impact analysis (BIA) report
Business impact analysis (BIA) is a crucial step in understanding how the different business functions of an enterprise will respond to unexpected events. One way to do this is to look at how much company revenue is being generated by the business unit at risk. If the BIA indicates that it’s a high percentage, the company will most likely want to prioritize creating a contingency plan for this business risk.
3. Make a plan
For each potential threat your company faces that has both a high likelihood of occurring and a high potential impact on business operations, you can follow these three simple steps to create a plan:
Identify triggers that will set a plan into action: For example, if a hurricane is approaching, when does the storm trigger your course of action? When it’s 50 miles away? 100 miles? Your teams will need clear guidance so they will know when to start executing the actions they’ve been assigned.
Design an appropriate response: The threat your organization prepared for has arrived and teams are springing into action. Everyone involved will need clear, accessible instructions, protocols that are easy to follow and a way to communicate with other stakeholders.
Delegate responsibility clearly and fairly: Like any other initiative, contingency planning requires effective project management to succeed. One proven way to address this is to create a RACI chart. RACI stands for responsible, accountable, consulted and informed, and it is widely used in crisis management to help teams and individuals delegate responsibility and react to crises in real time.
4. Get buy-in from the entire organization—and be realistic about cost
Sometimes it can be hard to justify the importance of putting resources into preparing for something that might never happen. But if the events of these past few years have taught us anything, it’s that having strong contingency plans is invaluable.
Think of the supply chain problems and critical shortages wreaked by the pandemic or the chaos to global supply chains brought about by Russia’s invasion of Ukraine. When it comes to convincing business leaders of the value of having a strong Plan B in place, it’s important to look at the big picture—not just the cost of the plan but the potential costs incurred if no plan is put in place.
5. Test and reassess your plans regularly
Markets and industries are constantly shifting, so the reality that a contingency plan faces when it is triggered might be very different than the one it was created for. Plans should be tested at least once annually, and new risk assessments performed.
Contingency plan examples
Here are some model scenarios that demonstrate how different kinds of businesses would prepare to face risks. The three-step process outlined here can be used to create contingency plans templates for whatever threats your organization faces.
A network provider facing a massive outage
What if your core business was so critical to your customers that downtime of even just a few hours could result in millions of dollars in lost revenue? Many internet and cellular networks face this challenge every year. Here’s an example of a contingency plan that would help them prepare to face this problem:
Assess the severity and likelihood of the risk: A recent study by Open Gear showed that only 9% of global organizations avoid network outages in an average quarter. Coupled with what is known about these attacks—that they can cause millions of dollars in damage and take an immeasurable toll on business reputation—this risk would have to be considered both highly likely and highly severe in terms of the potential damage it could do to the company.
Identify the trigger that will set your plan in action: In this example, what signs should decision-makers have watched for to know when a likely outage was beginning? These might include security breaches, looming natural disasters or any other event that has preceded outages in the past.
Create the right response: The organization’s leaders will want to determine a reasonable recovery time objective (RTO) and recovery point objective (RPO) for each service and data category their company faces. RTO is usually measured with a simple time metric, such as days, hours or minutes. RPO is a bit more complicated as it involves determining the minimum/maximum age of files that can be recovered quickly from backup systems in order to restore the network to normal operations.
A food distribution company coping with an unexpected shortage
If your core business has complex supply chains that run through different regions and countries, monitoring geopolitical conditions in those places will be critical to maintaining the health of your business operations. In this example, we’ll look at a food distributor preparing to face a shortage of a much-needed ingredient due to volatility in a region that’s critical to its supply chain:
Assess the severity and likelihood of the risk: The company’s leaders have been following the news in the region where they source the ingredient and are concerned about the possibility of political unrest. Since they need this ingredient to make one of their best-selling products, both the likelihood and potential severity of this risk are rated as high.
Identify the trigger that will set your plan in action: War breaks out in the region, shutting down all ports of entry/exit and severely restricting transport within the country via air, roads and railroads. Transportation of their ingredient will be impossible until stability returns to the region.
Create the right response: The company’s business leaders create a two-pronged contingency plan to help them face this problem. First, they proactively search for alternate suppliers of this ingredient in regions that aren’t so prone to volatility. These suppliers may cost more and take time to switch to, but when the overall cost of a general production disruption that would come about in the event of war is factored in, the cost is worth it. Second, they look for an alternative to this ingredient that they can use in their product.
A social network experiencing a customer data breach
The managers of a large social network know of a cybersecurity risk in their app that they are working to fix. In the event that they’re hacked before they fix it, they are likely to lose confidential customer data:
Assess the severity and likelihood of risk: They rate the likelihood of this event as high, since, as a social network, they are a frequent target of attacks. They also rate the potential severity of damage to the company as high since any loss of confidential customer data will expose them to lawsuits.
Identify the trigger that will set your plan in action: Engineers make the social network’s leadership aware that an attack has been detected and that their customer’s confidential information has been compromised.
Create the right response: The network contracts with a special response team to come to their aid in the event of an attack and help them secure their information systems and restore app functionality. They also change their IT infrastructure to make customer data more secure. Lastly, they work with a reputable PR firm to prepare a plan for outreach and messaging to reassure customers in the event that their personal information is compromised.
The value of contingency planning
When business operations are disrupted by a negative event, good contingency planning gives an organization’s response structure and discipline. During a crisis, decision-makers and employees often feel overwhelmed by the pile-up of events beyond their control, and having a thorough backup plan helps reestablish confidence and return operations to normal.
Here are a few benefits organizations can expect from strong contingency plans:
Improved recovery times: Businesses with good plans in place recover faster from a disruptive event than companies that haven’t prepared.
Reduced costs—financial and reputational: Good contingency plans minimize both financial and reputational damage to a company. For example, while a data breach at a social network that compromises customer information could result in lawsuits, it could also cause long-term damage if customers decide to leave the network because they no longer trust the company to keep their personal information safe.
Greater confidence and morale: Many organizations use contingency plans to show employees, shareholders and customers that they’ve thought through every possible eventuality that might befall their company, giving them confidence that the company has their interests in mind.
Contingency plan solutions
IBM Maximo Application Suite is an integrated cloud-based solution that helps businesses respond quickly to changing conditions. By combining the power of artificial intelligence (AI), Internet of Things (IoT) and advanced analytics, it enables organizations to maximize the performance of their most valuable assets, lengthen their lifespans and minimize costs and downtime.
Celsius filed for bankruptcy in 2022, alongside other leading crypto lenders.
Mashinsky’s bail must be signed by two financially recognizable persons.
Alex Mashinsky, the founder & former CEO of bankrupt crypto lender Celsius Network, has pleaded not guilty to fraud charges filed against him by the US Department of Justice.
Mashinsky was arrested on Thursday, with the DOJ charging him with securities fraud, wire fraud, and commodities fraud. The ex-Celsius CEO also faces accusations of manipulating the price of the crypto platform’s native asset CEL.
Mashinsky pleads not guilty
The DOJ’s arrest and arraignment of the ex-Celsius CEO came as the SEC also brought charges against Mashinky. The Commodity Futures Trading Commission (CFTC) has also filed complaints against him.
— U.S. Securities and Exchange Commission (@SECGov) July 13, 2023
Mashinksy pleaded not guilty to the DOJ charges and was granted a $40 million bail. The personal recognizance bond has to be signed by two persons deemed to be financially responsible.
According to court documents published on July 14, the former crypto figure’s wife is one of two FRPs, while the second FRP needs to append their signature today. A key date in this development is July 21, which is a court-set deadline for the second FRP.
While the former Celsius boss will be released without paying the $40 million bond, there’s a claim on his bank account and residence in New York. Mashinsky has also been ordered to surrender his travel documents to authorities and is prohibited from opening bank or cryptocurrency accounts unless first approved by Pretrial Services.
Mashinsky is yet another high-profile crypto figure to be arrested following the collapses and bankruptcies that hit crypto companies in 2022. Former FTX CEO Sam Bankman-Fried and Terra founder Do Kwon are others.
The court’s decision weakens the SEC’s stance that the securities law is clear and no separate clarity is required for digital assets, the report said.
Greg Oakford, co-founder of NFT Fest Australia, is your guide to the world of NFTs from a collector’s and fan’s perspective.
Andy Murray x Wimbledon x Refik Anadol
A special open edition NFT collaboration between tennis star Andy Murray, Wimbledon and well renowned digital artist, Refik Anadol. To commemorate the 10th anniversary of tennis star Andy Murray winning Wimbledon.
Andy Murray wearing sensors. (Twitter)
The Exposition” describes itself as ‘a world first exploration into the marriage of fine art, high performance sport and data science’. In the teaser video it reveals how the artwork is a visual representation of points played including body movement across Murray’s illustrious career at the last remaining grass court tennis major.
At a price point of $147, 248 editions have been minted to date with the mint window closing on 16 July. Buyers can mint using crypto or via a credit card on Manifold. Holders of the token will also later be afforded the opportunity to buy a physical print edition of the artwork.
The Exposition artwork. (Manifold)
I believe what we are witnessing here is the early signs of a trend for where sports memorabilia and general fandom is headed. The collaborative nature of digital art/collectibles and the ability to layer utility on top is too big of a value proposition for sports administrators and athletes alike to ignore.
The future will start with digital first. Scalability and accessibility are huge drivers for sports that command a global audience. As NBA Commissioner Adam Silver said last week at NBA Con:
“Because our buildings are essentially full, we can’t scale our arenas, 99.9-something of our fans only experience the NBA through our media. Through technology, how can we extend beyond that — products like NBA Top Shot are ways to do it.”
US Women’s Golf Open ArtBall
Last week, golf followed in the footsteps of the Australian Open tennis grand slam’s NFT project the AO ArtBall, rolling out a similar concept for the US Women’s Open. Using the same name ‘ArtBall’ the USGA teamed up with some of the same architects on the project, which ties a piece of the surface area of the sports field to an NFT.
More than 3000 people minted an NFT for free that correlated with a plot of the 17th green at host course Pebble Beach. In the tennis version a match point landing on your area saw your NFT upgraded, but the US Women’s Open opted for a variety of ways to provide upgradable traits including ‘landing points’, closest to the hole and longest hole out. More here on how the mechanics worked.
The ArtBall concept is a strong one where we see the integration of existing highly sophisticated sports data tracking technology and a new way to engage with fans by blurring the lines between physical and digital experiences.
Kudos to artist Amy Goodchild who spearheaded the generative art on the golf balls. They look very clean and crisp. This is another example of sport and art blending together via NFTs.
Examples of the official ArtBall from the 2023 US Women’s Open. (usga.artball.io)
UFC to integrate collectibles with a mobile-first game
The UFC announced a new multi-year partnership with Concept Labs to help build upon the already launched UFC Strike collectibles product built on Flow.
Cornerstones of the new deal include UFC Strike: Fight Camp — a mobile-first roster management game compatible with UFC Strike digital collectibles, holders will also participate in matchmatcher sweepstakes where you can meet UFC president Dana White to pitch a dream fight matchup, plus other exclusive digital and IRL fan experiences.
What’s hot in NFT art markets
Some big sales for Fidenzas at 75 ETH and 71 ETH, Ringers #514 went for 88 ETH and a Bold Chromie Squiggle sold for 28.5 ETH.
Also read: Fidenza: Tyler Hobbs wrote software that generates art worth millions
But the past week has really belonged to Terraforms by Mathcastles with more than 145 sales for the onchain land art project that launched in December 2021. By comparison, the previous week saw 50 sales. The collection floor moved from 1.2 ETH up to 2.17 ETH the past seven days.
Fidenza #558 sold for 75 ETH, $140K. (OpenSea)Ringers #514 sold for 88 ETH, $165K (OpenSea) Chromie Squiggle #9514 sold for 28.5 ETH, $56K (OpenSea)
NFT Creator: tjo
We meet a genius of mixed media artists, tjo from Quebec, Canada.
Who is tjo?
Originally introduced to NFTs by friend Wally Sajimi around the end of 2020, tjo’s truly unique art is an outlet for his diagnosed OCD condition and strives to shine a light on mental health. He minted his first token on 23 February 2021, saying he understood very little about NFTs at the time but found it “mesmerizing.”
BLeU by tjo sold for 69.42 ETH, $113,100 equivalent on date of sale. (SuperRare )
“My own emotions and experiences with pure OCD greatly influence my art. I don’t want people to feel a particular emotion when engaging with it, rather I hope it forces them to look into a deep place within themselves and get out feelings that were always there.”
“I also hope that the people who have dealt with mental disorders feel better about their differences by sharing these experiences.”
tjo’s style and influences
With a background in physical paintings and photography, tjo, like many other artists minting works on the blockchain doesn’t like to be pigeon holded as a particular type of artist.
“I don’t particularly appreciate how we discuss style in markets like NFTs. It is weaponized as a vehicle for speculation without regard to historical context. If forced to pin down my art into a category, I would fall under mixed media. It is straightforward; I mix a variety of mediums and approaches, both digital and physical,” says tjo.
Greek mythology and anime are two big influences on his work.
“To find myself and a visual language I felt was proper to myself; many artists greatly influenced me, such as Francis Bacon (Irish-born British figurative painter), Jean-Michel Basquiat (American artist part of the neo-expressionism movement), Tim Walker (British fashion photographer), Frank Ockenfels (American photographer and artist of celebrities) Kazimir Malevich (Russian avant-garde artist) and many more.”
Rapid fire Q&A
What’s your favorite NFT in your wallet that’s not your own NFT?
i hate u by tjo – sold for 40.69 ETH, $78,400 equivalent on date of sale. (SuperRare)
Is there an up and coming artist/s you think people should be paying attention to?
“There are thousands of artists people should be looking into, but if I had to point people towards a starting point, the Kula Collective and Making It are groups of amazing artists.”
Who is a notable collector of yours that makes you smile knowing they own one of your pieces?
“An OG that collected one of my early pieces was Path. I think that brought a lot of eyes to me, and I’m grateful that he still owns the piece he bought.”
Vegas Sphere captures imagination of digital art enthusiasts
Las Vegas captured the imagination of the sports world last week with the debut of No.1 draft pick, 7’5” Victor Wembanyama in the NBA Summer League and T-Mobile Stadium playing host to UFC290 during international fight week. But for digital art enthusiasts the only game in town was the imagery coming from the Vegas MSG Sphere.
The $2.3 billion construction is the home of a new 17,500 seat stadium that doubles as the best interactive billboard you’ve ever seen.
As digital art continues to push the boundaries in a rapidly accelerating creative environment layered on top with provenance via NFTs, a big unanswered question remains of how to best display digital art to truly do the work justice.
We’ve seen the introduction of premium screens such as Danvas and digital galleries around the world like JRNY that just opened in Vegas and Oshi Gallery in Melbourne, Australia but it feels like we’re still scratching the surface. Well, what bigger surface area than 580,000 square feet of the Sphere.
Surely it’s just a matter of time until we see iconic digital art such as CryptoPunks, Fidenzas, Ringers, Chromie Squiggles, XCOPY having their moment on the Sphere, or maybe Jake Fried’s ‘Ball’. Could only imagine what a giant ball rolling down hill at you on the Vegas strip might look like as you jump into the Uber after a few drinks.
Tweet of the week
What do artists listen to when they create work: tjo edition.
Greg Oakford is the co-founder of NFT Fest Australia. A former marketing and communications specialist in the sports world, Greg now focuses his time on running events, creating content and consulting in web3. He is an avid NFT collector and hosts a weekly podcast covering all things NFTs.
In short, yes. When we talk about data integrity, we’re referring to the overarching completeness, accuracy, consistency, accessibility, and security of an organization’s data. Together, these factors determine the reliability of the organization’s data. Data quality uses those criteria to measure the level of data integrity and, in turn, its reliability and applicability for its intended use. Data quality and integrity are vital to a data-driven organization that employs analytics for business decisions, offers self-service data access for internal stakeholders and provides data offerings to customers.
Data integrity
To achieve a high level of data integrity, an organization implements processes, rules and standards that govern how data is collected, stored, accessed, edited and used. These processes, rules and standards work in tandem to:
Validate data and input
Remove duplicate data
Provide data backups and ensure business continuity
Safeguard data via access controls
Maintain an audit trail for accountability and compliance
An organization can use any number of tools and private or public cloud environments throughout the data lifecycle to maintain data integrity through something known as data governance. This is the practice of creating, updating and consistently enforcing the processes, rules and standards that prevent errors, data loss, data corruption, mishandling of sensitive or regulated data, and data breaches.
The benefits of data integrity
An organization with a high level of data integrity can:
Increase the likelihood and speed of data recoverability in the event of a breach or unplanned downtime
Protect against unauthorized access and data modification
Achieve and maintain compliance more effectively
Good data integrity can also improve business decision outcomes by increasing the accuracy of an organization’s analytics. The more complete, accurate and consistent a dataset is, the more informed business intelligence and business processes become. As a result, leaders are better equipped to set and achieve goals that benefit their organization and drive employee and consumer confidence.
Data science tasks such as machine learning also greatly benefit from good data integrity. When an underlying machine learning model is being trained on data records that are trustworthy and accurate, the better that model will be at making business predictions or automating tasks.
The different types of data integrity
There are two main categories of data integrity: Physical data integrity and logical data integrity.
Physical data integrity is the protection of data wholeness (meaning the data isn’t missing important information), accessibility and accuracy while data is stored or in transit. Natural disasters, power outages, human error and cyberattacks pose risks to the physical integrity of data.
Logical data integrity refers to the protection of data consistency and completeness while it’s being accessed by different stakeholders and applications across departments, disciplines, and locations. Logical data integrity is achieved by:
Preventing duplication (entity integrity)
Dictating how data is stored and used (referential integrity)
Preserving data in an acceptable format (domain integrity)
Ensuring data meets an organization’s unique or industry-specific needs (user-defined integrity)
How data integrity differs from data security
Data security is a subcomponent of data integrity and refers to the measures taken to prevent unauthorized data access or manipulation. Effective data security protocols and tools contribute to strong data integrity. In other words, data security is the means while data integrity is the goal. Data recoverability — in the event of a breach, attack, power outage or service interruption — falls under the realm of data security.
The consequences of poor data integrity
Human errors, transfer errors, malicious acts, insufficient security and hardware malfunctions all contribute to “bad data,” which negatively impacts an organization’s data integrity. An organization contending with one or more of these issues risks experiencing:
Poor data quality
Low-quality data leads to poor decision-making because of inaccurate and uninformed analytics. Reduced data quality can result in productivity losses, revenue decline and reputational damage.
Insufficient data security
Data that isn’t properly secured is at an increased risk of a data breach or being lost to a natural disaster or other unplanned event. And without proper insight and control over data security, an organization can more easily fall out of compliance with local, regional, and global regulations, such as the European Union’s General Data Protection Regulation.
Data quality
Data quality is essentially the measure of data integrity. A dataset’s accuracy, completeness, consistency, validity, uniqueness, and timeliness are the data quality measures organizations employ to determine the data’s usefulness and effectiveness for a given business use case.
How to determine data quality
Data quality analysts will assess a dataset using dimensions listed above and assign an overall score. When data ranks high across every dimension, it is considered high-quality data that is reliable and trustworthy for the intended use case or application. To measure and maintain high-quality data, organizations use data quality rules, also known as data validation rules, to ensure datasets meet criteria as defined by the organization.
The benefits of good data quality
Improved efficiency
Business users and data scientists don’t have to waste time locating or formatting data across disparate systems. Instead, they can readily access and analyze datasets with greater confidence. Additional time is saved that would have otherwise been wasted on acting on incomplete or inaccurate data.
Increased data value
Because data is formatted consistently and contextualized for the user or application, organizations can derive value from data that may have otherwise been discarded or ignored.
Improved collaboration and better decision-making
High-quality data eliminates incongruency across systems and departments and ensures consistent data across processes and procedures. Collaboration and decision-making among stakeholders are improved because they all rely on the same data.
Reduced costs and improved regulatory compliance
High-quality data is easy to locate and access. Because there is no need to re-create or track down datasets, labor costs are reduced, and manual data entry errors become less likely. And because high-quality data is easy to store in the correct environment as well as collect and compile in mandatory reports, an organization can better ensure compliance and avoid regulatory penalties.
Improved employee and customer experiences
High-quality data provides more accurate, in-depth insights an organization can use to provide a more personalized and impactful experience for employees and customers.
The six dimensions of data quality
To determine data quality and assign an overall score, analysts evaluate a dataset using these six dimensions, also known as data characteristics:
Accuracy: Is the data provably correct and does it reflect real-world knowledge?
Completeness: Does the data comprise all relevant and available information? Are there missing data elements or blank fields?
Consistency: Do corresponding data values match across locations and environments?
Validity: Is data being collected in the correct format for its intended use?
Uniqueness: Is data duplicated or overlapping with other data?
Timeliness: Is data up to date and readily available when needed?
The higher a dataset scores in each of these dimensions, the greater its overall score. A high overall score indicates that a dataset is reliable, easily accessible, and relevant.
How to improve data quality
Some common methods and initiatives organizations use to improve data quality include:
Data profiling
Data profiling, also known as data quality assessment, is the process of auditing an organization’s data in its current state. This is done to uncover errors, inaccuracies, gaps, inconsistent data, duplications, and accessibility barriers. Any number of data quality tools can be used to profile datasets and detect data anomalies that need correction.
Data cleansing
Data cleansing is the process of remediating the data quality issues and inconsistencies discovered during data profiling. This includes the deduplication of datasets, so that multiple data entries don’t unintentionally exist in multiple locations.
Data standardization
This is the process of conforming disparate data assets and unstructured big data into a consistent format that ensures data is complete and ready for use, regardless of data source. To standardize data, business rules are applied to ensure datasets conform to an organization’s standards and needs.
Geocoding
Geocoding is the process of adding location metadata to an organization’s datasets. By tagging data with geographical coordinates to track where it originated from, where it has been and where it resides, an organization can ensure national and global geographic data standards are being met. For example, geographic metadata can help an organization ensure that its management of customer data stays compliant with GDPR.
Matching or linking
This is the method of identifying, merging, and resolving duplicate or redundant data.
Data quality monitoring
Maintaining good data quality requires continuous data quality management. Data quality monitoring is the practice of revisiting previously scored datasets and reevaluating them based on the six dimensions of data quality. Many data analysts use a data quality dashboard to visualize and track data quality KPIs.
Batch and real-time validation
This is the deployment of data validation rules across all applications and data types at scale to ensure all datasets adhere to specific standards. This can be done periodically as a batch process, or continuously in real time through processes like change data capture.
Master data management
Master data management (MDM) is the act of creating and maintaining an organization-wide centralized data registry where all data is cataloged and tracked. This gives the organization a single location to quickly view and assess its datasets regardless of where that data resides or its type. For example, customer data, supply chain information and marketing data would all reside in an MDM environment.
Data integrity, data quality and IBM
IBM offers a wide range of integrated data quality and governance capabilities including data profiling, data cleansing, data monitoring, data matching and data enrichment to ensure data consumers have access to trusted, high-quality data. IBM’s data governance solution helps organizations establish an automated, metadata-driven foundation that assigns data quality scores to assets and improves curation via out-of-the-box automation rules to simplify data quality management.
With data observability capabilities, IBM can help organizations detect and resolve issues within data pipelines faster. The partnership with Manta for automated data lineage capabilities enables IBM to help clients find, track and prevent issues closer to the source.
Learn more about designing the right data architecture to elevate your data quality here.
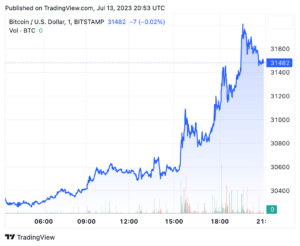
Bitcoin and the rest of the cryptocurrency market saw significant gains after Ripple secured a victory against securities regulators on July 13.
As of 8:30 p.m. UTC, Bitcoin (BTC) had gained 4.3% over 24 hours, achieving a $31,594.31 market value and a $613.8 billion market cap. That change represents more than a one-year high, as the asset has not seen comparable prices since June 2022.
Ethereum (ETH), meanwhile, gained 6.9% over 24 hours for a market cap of $239.8 billion. Its price briefly surpassed $2,000.
Those gains were likely influenced by the outcome of a legal case between Ripple and the U.S. Securities and Exchange Commission in which courts ruled that Ripple’s XRP sales are not securities. XRP itself gained 73% over 24 hours to reach a $42.6 billion market cap, making it the 4th largest cryptocurrency at present.
At least two major crypto exchanges — Coinbase and Gemini — have decided to list or are considering listing XRP following Ripple’s legal victory. Those decisions could further support the price of the XRP token.
Three coins named in unrelated SEC cases against Coinbase and Binance are also among the biggest gainers today: Cardano (ADA) rose 19.5%, Solana (SOL) rose 17.3%, and Polygon (MATIC) rose 17.8%. Those gains are perhaps due to more general optimism that is possible for crypto companies to win cases against regulators.
Various other assets have also seen gains. Stellar (XLM), which has early ties to Ripple but is otherwise an independent project, saw gains of 62.4%. The entire crypto market has gained 6.5% over 24 hours for a total market capitalization of $1.3 trillion.
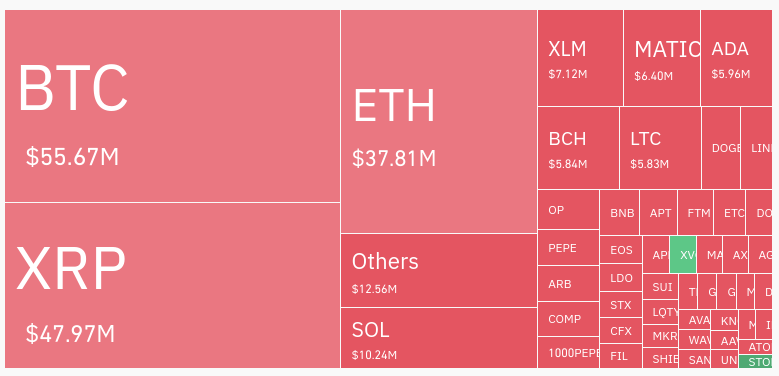
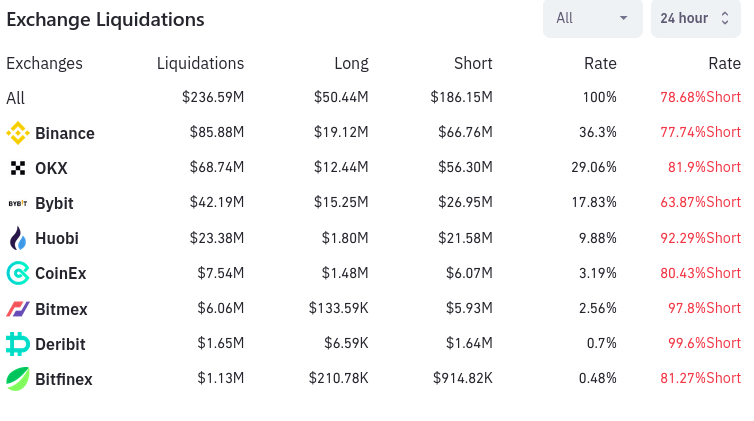
Liquidations reach $236 million
Meanwhile, the crypto market saw $238.37 million in liquidations over a 24-hour period. That total includes $52.01 million of long liquidations and $186.36 million of short liquidations. About 66,800 traders were liquidated in total.
Liquidations for July 13, 2023, via CoinGlass
Three assets saw the most liquidations. Bitcoin saw $55.67 million in liquidations, Ethereum saw $37.81 million in liquidations, and XRP saw $47.97 million in liquidations.
Binance was responsible for $85.88 million in liquidations, while OKX was similarly responsible for $68.74 million in liquidations. Together, those two exchanges were responsible for about two-thirds of all liquidations across the cryptocurrency market.
Various other exchanges, including Bybit, Huobi, and CoinEX, were responsible for the remainder of those liquidations, as shown below:
Exchange liquidations for July 13, 2023, via Coinglass
The events of the day represent rare positive news amidst the crypto industry’s latest bear market. Though the broader implications of the Ripple case are still unclear, the latest developments seem to have generated optimism among cryptocurrency investors.
Shiba Memu is a new meme cryptocurrency that taps into the power of AI and blockchain.
Through AI, Shiba Memu will be a self-sustaining marketing powerhouse, delivering value to investors.
The price of the meme token increases every day, and its presale concludes in 8 weeks.
Who thought meme cryptocurrencies would have so much following and attraction in this day and era? Just in early 2020, the market cap of the total meme token market was $0. In early 2022, the market was valued at over $20 billion, showing how much potential meme tokens have. Early entrants like Doge and Shiba Inu and latecomers like Pepe Coin have always elicited enthusiasm. But now, we are talking of a new meme coin that combines AI and blockchain technology, Shiba Memu(SHMU). Since launching its presale, Shiba Memu has hit unprecedented demand, with more than 26,755,000 tokens sold.
What is Shiba Memu (SHMU)?
Shiba Memu is not your usual meme cryptocurrency. It is a revolutionary coin that taps into the power of AI and blockchain to create a self-sustaining marketing powerhouse.
As you already know, AI has been a buzzword since ChatGPT came into being in November 2022. Who doesn’t know what ChatGPT can do today, including letting you do serious stuff like writing code or drafting an assignment?
Shiba Memu is a meme cryptocurrency that embodies the unique attributes of AI to learn and promote itself across social networks and other forums. With the help of AI-based software, Shiba Memu can write its own PR and promote successful marketing strategies.
Shiba Memu is also learning 24/7, all on its own, to become a better version of itself. As the power of AI grows, Shiba Memu will become more intelligent and powerful, achieving more than what hundreds or thousands of marketing agencies combined can do.
Does investing in Shiba Memu make sense?
Up to now, meme tokens have shown great potential, eliciting reactions even more than mainstream cryptocurrencies like Bitcoin. The potential reason is that investors are looking for fun and creative ways to engage in crypto, which is only possible through meme tokens.
But investing in Shiba Memu is more than that. It carries a value proposition owing to its AI capabilities. It doesn’t need those annoying Twitter or Reddit spats to gain traction. The token will pick battles on its own and generate hype using AI. This is its essence of being a meme token and remaining independent. That means the token can potentially explode in value and generate significant returns to investors.
Aside from that, who wants to miss out on the AI train? Tech wars are moving to AI, just like the internet disrupted everything and made adoption the only survival tactic. Put simply, Shiba Memu’s AI angle manifests a trend that is catching up with us. The inevitable shift into AI makes Shiba Memu a worthwhile investment in the future.
Shiba price increases every day
Shiba Memu is always on the move, right from the presale. The price of the token rises each day at 6 pm GMT, which is quite positive for its incremental value addition. Throughout the presale, the price will have doubled from a starting value of $0.011125 to $0.0244.
Shiba Memu’s presale will last for 8-weeks and conclude with whatever amount investors will have put in. Token distribution will start when the presale ends. Since the project runs on ERC20 and BSC networks, investors can buy it with Ethereum, USDT, BNB, and BUSD.
Should you invest in Shiba Memu now?
Time is of the essence in investment, and finding projects that can deliver exceptional returns feels like a gift. History has taught that meme cryptocurrencies are most ideal when the hype is building up rather than when FOMO has dried up.
If meme crypto is your preferred investment, this could be the right time to pick Shiba Memu before the presale ends. The potential for the token is huge, and the application area through AI is limitless.
“Despite market volatility, a fall in digital asset prices and the collapse of a number of crypto businesses, investment in crypto-assets is expected to remain strong in 2023,” Jon Garvey, PwC United States’ global financial services leader, said. “Traditional hedge funds, committed to the market in the longer term, are not only increasing their crypto-assets under management, but also maintaining – if not increasing – the amount of capital deployed in the ecosystem.”
 Price Surges Over 50%")


 bursts into the meme scene with an unstoppable demand")
