
[ad_1]
Shanghai is the next major Ethereum upgrade, scheduled to go live on April 12.
Once implemented, ETH staked on the staking contract will be unlocked and withdrawable – thus finalizing the process that began with the Beacon Chain launch in December 2020.
The implication of the Shanghai upgrade is subject to much speculation. Some expect the spot price to tank as holders liquidate. Others believe moving into and out of the staking contract easily will attract more stakers, leading to price stability.
Glassnode data analyzed by CryptoSlate suggested Ethereum derivatives traders are cautious going into the Shanghai upgrade. However, post-Shanghai, sentiment relaxes.
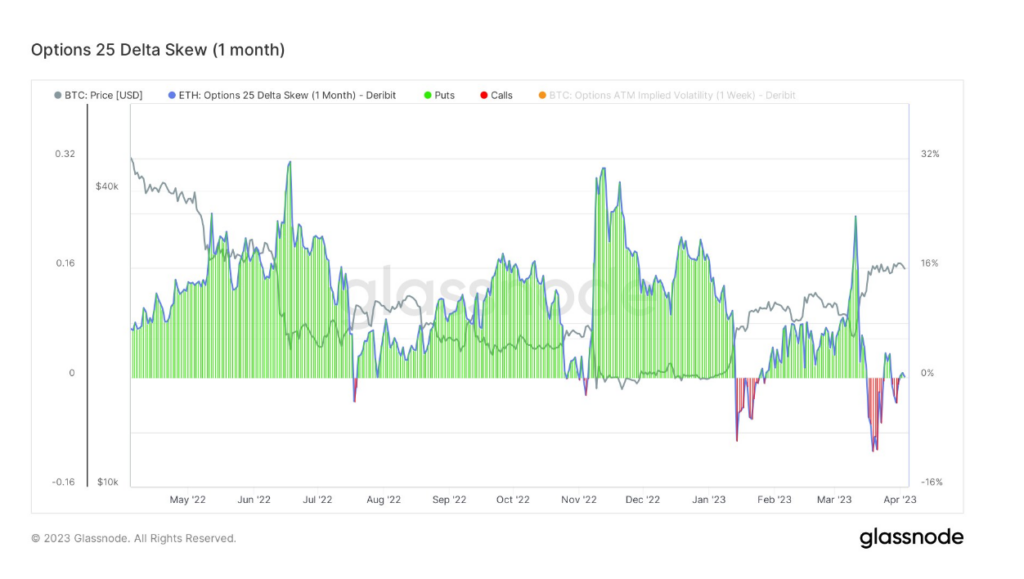
Ethereum – Options 25 Delta Skew
The Options 25 Delta Skew metric looks at the ratio of put-to-call options expressed in terms of Implied Volatility (IV).
A call option gives the holder the right to buy an asset, and a put option gives the holder the right to sell an asset.
For options with a specific expiration date, this metric looks at puts with a delta of -25% and calls with a delta of +25%, netted off to arrive at a data point – giving a measure of the option’s price sensitivity taking into account the change in Ethereum spot price.
Typically, this metric can be organized by periods at which the option contract expires, such as one week, one month, three months, and six months.
The chart below relates to options expiring in a week (near term); it shows puts are now at a premium, suggesting the market is cautious as the Shanghai rollout nears.
The 1-month 25 Delta Skew is somewhat evenly poised between puts and calls, pointing to a settling of sentiment post-Shanghai.
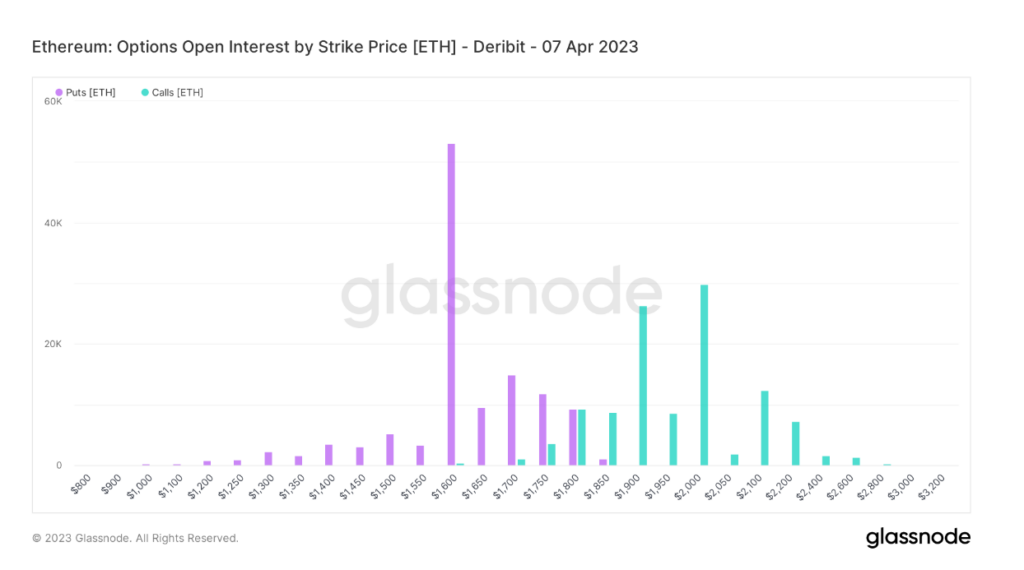
Open Interest
Open Interest by Strike Price refers to the total number of outstanding derivatives contracts yet to settle, organized by the exercised put or call price.
This metric is used to gauge the general market sentiment, particularly the strength behind put or call price trends.
The chart below for April 7 shows puts dominating, with the $1,600 strike price far in the lead at over 50,000 contracts.
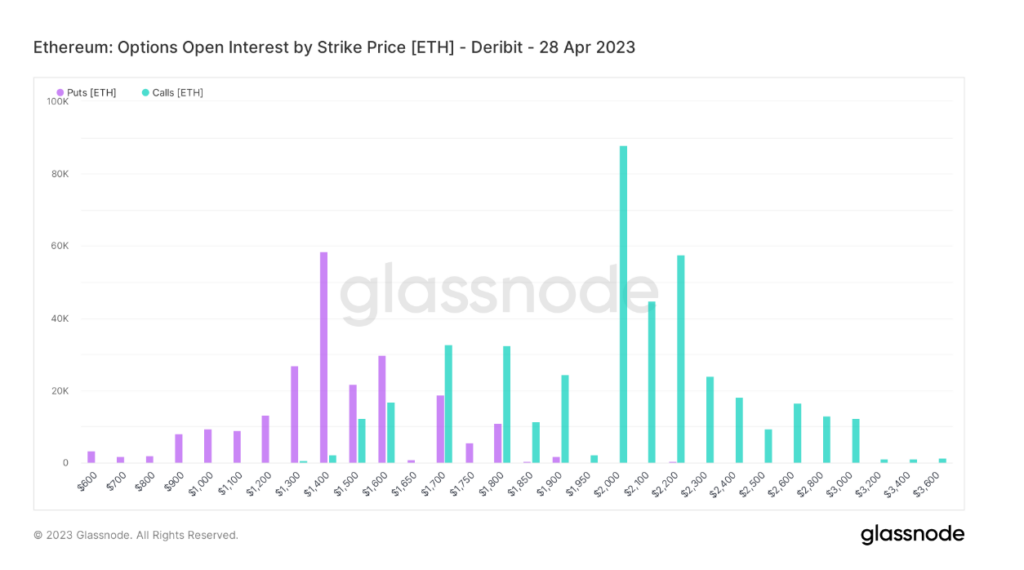
Looking beyond Shanghai’s go-live date, towards the end of April, the frequency of puts versus calls has evened up compared to April 7. However, sentiment swings the other way, with calls at $2,000 being the most frequent choice at around 90,000 contracts.
As such, moving into next month, traders are signaling a more optimistic outlook.
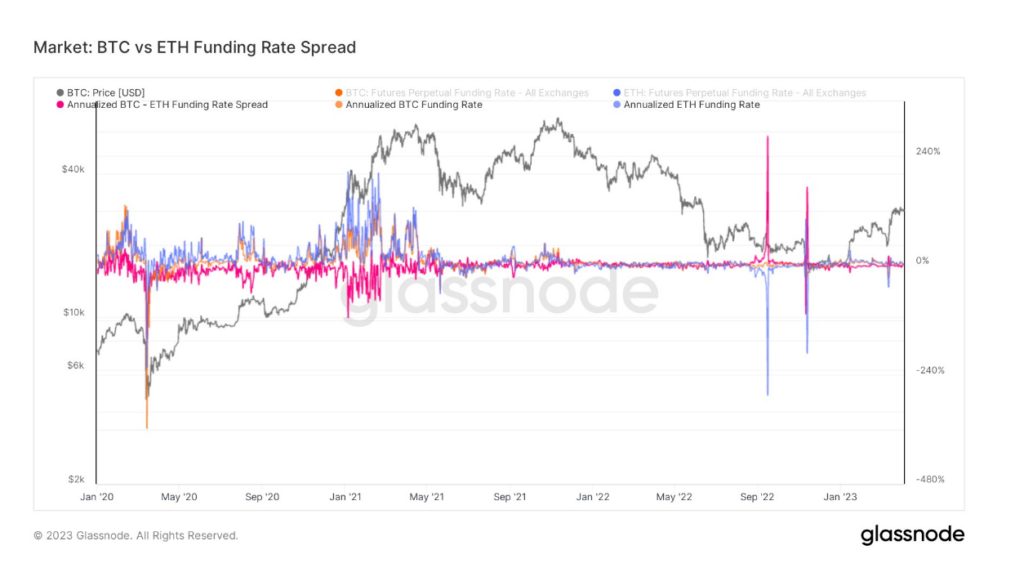
Funding Rate Spread
The Funding Rate refers to periodic payments made to or by derivatives traders, both long and short, based on the difference between perpetual contract markets and the spot price.
When the funding rate is positive, the price of the perpetual contract is higher than the marked price. In such cases, long traders pay for short positions. By contrast, a negative funding rate shows perpetual contracts are priced below the marked price, and short traders pay for longs.
This mechanism ensures futures contract prices fall in line with the underlying spot price.
In this case, the spread refers to the difference in the annualized BTC and ETH Funding Rates.
During the Merge in September 2022, the annualized ETH Funding Rate sunk as low as -282% – indicating short traders were overwhelmingly bearish and willing to pay for longs.
Fast forward to now, the magnitude of moves has lessened to a significant extent compared to last September. Yesterday, ETH traders posted a slightly positive Funding Rate at 0.14% – suggesting mildly bullish sentiment. Compared to the BTC Funding Rate of 2.8%, this indicates a somewhat more pessimistic view than Bitcoin traders.
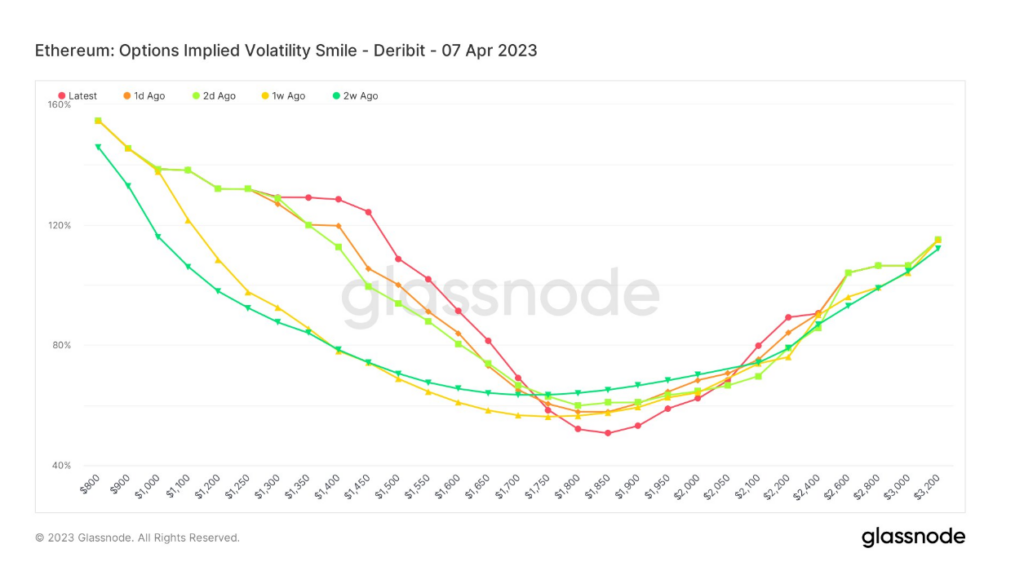
Implied Volatility Smile
The Volatility Smile results from plotting the Strike Price and Implied Volatility (IV) of options with the same underlying asset and expiration date.
IV rises when the underlying asset of an option is further out-of-the-money (OTM), or in-the-money (ITM), compared to at-the-money (ATM).
Options further OTM generally indicate higher IVs, giving Volatility Smile charts their distinctive “smile” shape. The steepness and shape of the smile can be used to assess the relative expensiveness of options and gauge what kind of tail risks the market has priced in.
Comparing the “Latest” smile to historical overlays from one day, two days, one week, and two weeks ago, it is possible to determine the degree of implied volatility on either side of ATM.
The chart below shows markets are paying a premium for downside protection before the Shanghai upgrade. IV is well above 100%.
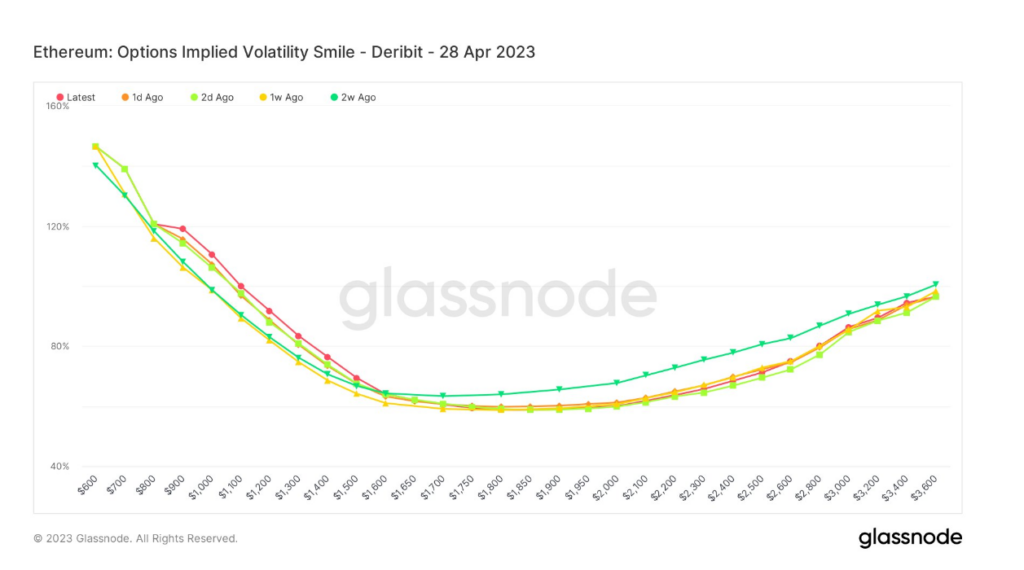
Post-upgrade, markets continue paying a premium for downside protection. But the patterns have smoothed out significantly, showing a slight decline on the right tail, with a relatively flat shape and sub 100% IV across the right side curve.
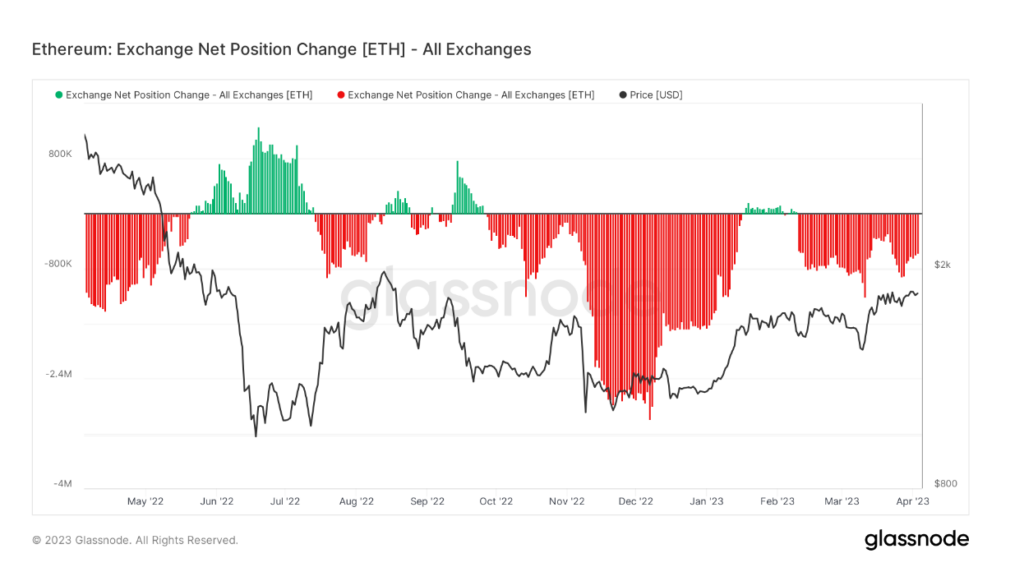
Spot demand
Exchange Net Position Change (ENPC) measures the coins deposited or withdrawn from exchange wallets.
Inflows or positive change is generally considered bearish, as the primary reason to transfer to an exchange is to sell. Whereas outflows, or negative change, is usually regarded as bullish, the main reason to withdraw relates to wallet storage – thus hodling.
Since mid-February, ETH’s ENPC has flipped negative, suggesting strong spot demand in the run-up to Shanghai.
The post Research: Ethereum derivatives traders signal caution ahead of Shanghai upgrade appeared first on CryptoSlate.
[ad_2]